Back to the blog
ROS2 Graph Monitor: A Continuous Snapshot of Your Robot’s State
Robotics

ROS2 Graph Monitor: A Continuous Snapshot of Your Robot’s State

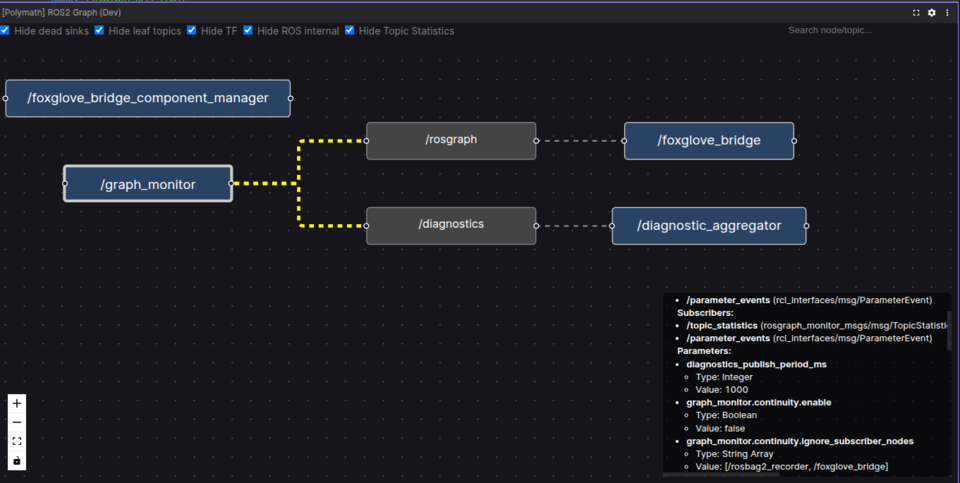
Meet our open-source ROS2 Graph Monitor with a Foxglove extension -- giving engineers a continuous, queryable snapshot of their robot’s system state to simplify debugging and analysis.

Troy Gibb
September 4, 2025

For years, ROS 2 users have struggled to get a clear and complete snapshot of their system state at a moment in time. Today, we're excited to announce our open-source  work on  ROS2 Graph Monitor in conjunction with a Foxglove extension to help solve that problem:

The problem we're solving

ROS2 is made up of nodes that connect to each other through topics, services, and actions. When something goes wrong, being able to see the exact connections at the moment of failure is critical.

But the existing options to do this introspection have always been clunky. You might run a script on the robot to spit out a static image of the graph, but that's not something you can easily query later or pair with a bag recording to make the debugging process easier. And due to the distributed nature of a ROS 2 application, this is not easy to do instantaneously, it is better solved by a long-running observer of the system.

If a graph-related issue happened in the field two weeks ago, you'd be out of luck.

How ROS Graph Monitor came to be

On the Polymath team, we've wanted the capability to assess the health of the ROS2 graph for a long time. Emerson Knapp released an initial version with his  ROSCon 2024 talk on the subject (side note: that was how the Polymath team first connected with him!). Shortly after, we brought that work into the Polymath stack.

While we ran the rosgraph monitor continuously, it wasn’t until our engineer Dhruv Tyagi decided to build a ROS graph visualizer in Foxglove Studio that things started to click: we could pair Dhruv’s visualizer with a publisher that continuously outputs the graph structure. That way, you could record the graph state alongside other telemetry and inspect it any time.

How it works

The system we’re discussing is made of two independent components. One component, the graph monitor, observes and publishes the ROS graph - every node, topic, parameter and connection - at a set interval and whenever something changes. With this information available, you can use the Foxglove panel to explore it visually.

Now, if you have a bag file from that weird day in the field, you can jump back in time and see exactly what the system looked like. You can spot which topics were active, how often they were publishing, and whether something drifted from its normal state.

Why it matters

Say your costmap generation has degraded. You suspect your LiDAR is publishing at a reduced rate. With ROS Graph Monitor, you can pull up a snapshot from before and during the problem, see the drop from 20Hz to a much lower rate, and confirm the basic root cause without trawling through individual messages.

It's almost like running a blood panel for your robot. You are not looking at every individual reading, just the high-level state (and variances from expected values) that tells you where to focus.

Open source and ready to use

The ROS Graph Monitor is now released into ROS 2 distributions, and the Foxglove extension is now open source. You can use them in your application today, and soon the extension will be available on the Foxglove public registry.

What's next

There is an active backlog for both of these tools. Visualizing topic frequencies is high on the list, so you could glance at the graph and see which areas are “hot” and which are “cold.” There is also a lot of room for improvement in the rendering of the ROS graph in the panel. 

These kinds of tools don't directly make a robot more reliable, but they make engineers far more effective. The faster you can see what is going on, the faster you can fix it.

Written By
Troy Gibb
Troy Gibb is a Staff Engineer at Polymath Robotics, bringing deep expertise in simulation and visualization from his years at Cruise, where he built core tools for autonomous vehicle development.

Troy Gibb is a Staff Engineer at Polymath Robotics, bringing deep expertise in simulation and visualization from his years at Cruise, where he built core tools for autonomous vehicle development.

Want to stay in the loop?

Get updates & robotics insights from Polymath when you sign up for emails.

Thank you! Your submission has been received!
Oops! Something went wrong while submitting the form.